Can Stellar (XLM) Price Bounce at Current Support?

Stellar’s (XLM) price has fallen since reaching a new yearly high in July. The decrease accelerated after a breakdown of a symmetrical triangle.
The Stellar price is approaching a long-term horizontal support level at $0.105, which could end the decrease.
Stellar Price Decrease Continues for the Fourth Week in a Row
The XLM price analysis on a weekly time frame reveals a bullish development. In January, XLM broke through a resistance line that had been in place for 616 days. This type of breakout from a long-standing structure suggests a shift from the previous trend to a new one in the opposite direction.
Initially, XLM faced difficulty surpassing the $0.105 resistance level. However, it managed to establish a higher low in June and subsequently accelerated its upward momentum.
Sponsored
Sponsored
After successfully overcoming the $0.105 resistance, XLM reached a new yearly peak of $0.195 in July. Despite this, its trajectory has since turned downwards, evident from three consecutive bearish weekly candlesticks.
Currently, XLM is in the process of forming a fourth bearish candlestick, potentially leading to a further decline towards the $0.105 level, which is now anticipated to act as a support.
If a bounce at this level occurs, the XLM price can increase by 105% and reach the $0.230 resistance area. On the other hand, a breakdown from the $0.105 area could lead to a 35% decrease toward the yearly lows near $0.070.
Assessing the weekly Relative Strength Index (RSI) presents an inconclusive outcome. Traders utilize the RSI as an indicator of momentum to evaluate whether a market is excessively bought or sold, aiding in their decisions to buy or sell an asset.
An RSI reading above 50 and an ascending pattern indicate a continuing bullish sentiment. Conversely, readings below 50 suggest a bearish sentiment.
Despite a declining RSI, the indicator remains above the 50 mark. These conflicting signals do not clearly confirm the prevailing trend direction.
XLM Price Prediction: Triangle Breakdown Catalyzes Drop
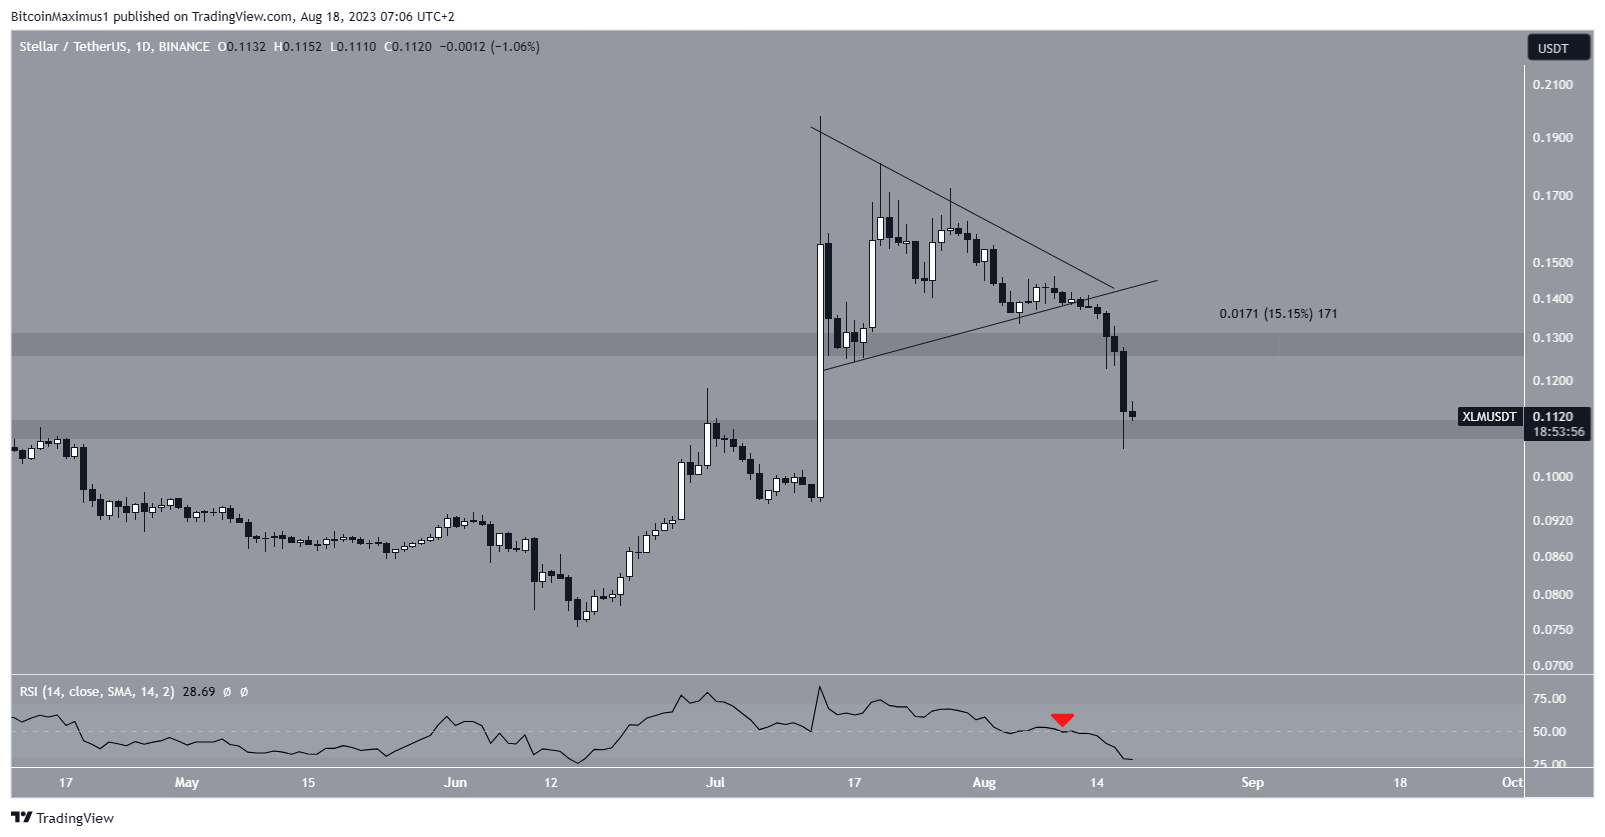
The daily timeframe analysis provides a mostly bearish outlook. The main reason for this is the breakdown of a symmetrical triangle that had been in place since July 14. XLM broke down from the triangle on August 13 and then fell below the minor $0.13 horizontal support area.
The daily RSI suggests that the price will continue decreasing. The indicator fell below 50 (red icon) and is decreasing. These are both considered signs of a bearish trend. They also provide legitimacy to the breakdown.
As outlined prior, a breakdown can lead to another 35% decrease.

Despite this bearish XLM price prediction, a strong bounce at the current support area can lead to a 15% increase that can validate the $0.130 horizontal resistance area.
For BeInCrypto’s latest crypto market analysis, click here.
Disclaimer
In line with the Trust Project guidelines, this price analysis article is for informational purposes only and should not be considered financial or investment advice. BeInCrypto is committed to accurate, unbiased reporting, but market conditions are subject to change without notice. Always conduct your own research and consult with a professional before making any financial decisions.


